Documentation Index
Fetch the complete documentation index at: https://docs.redbrickai.com/llms.txt
Use this file to discover all available pages before exploring further.
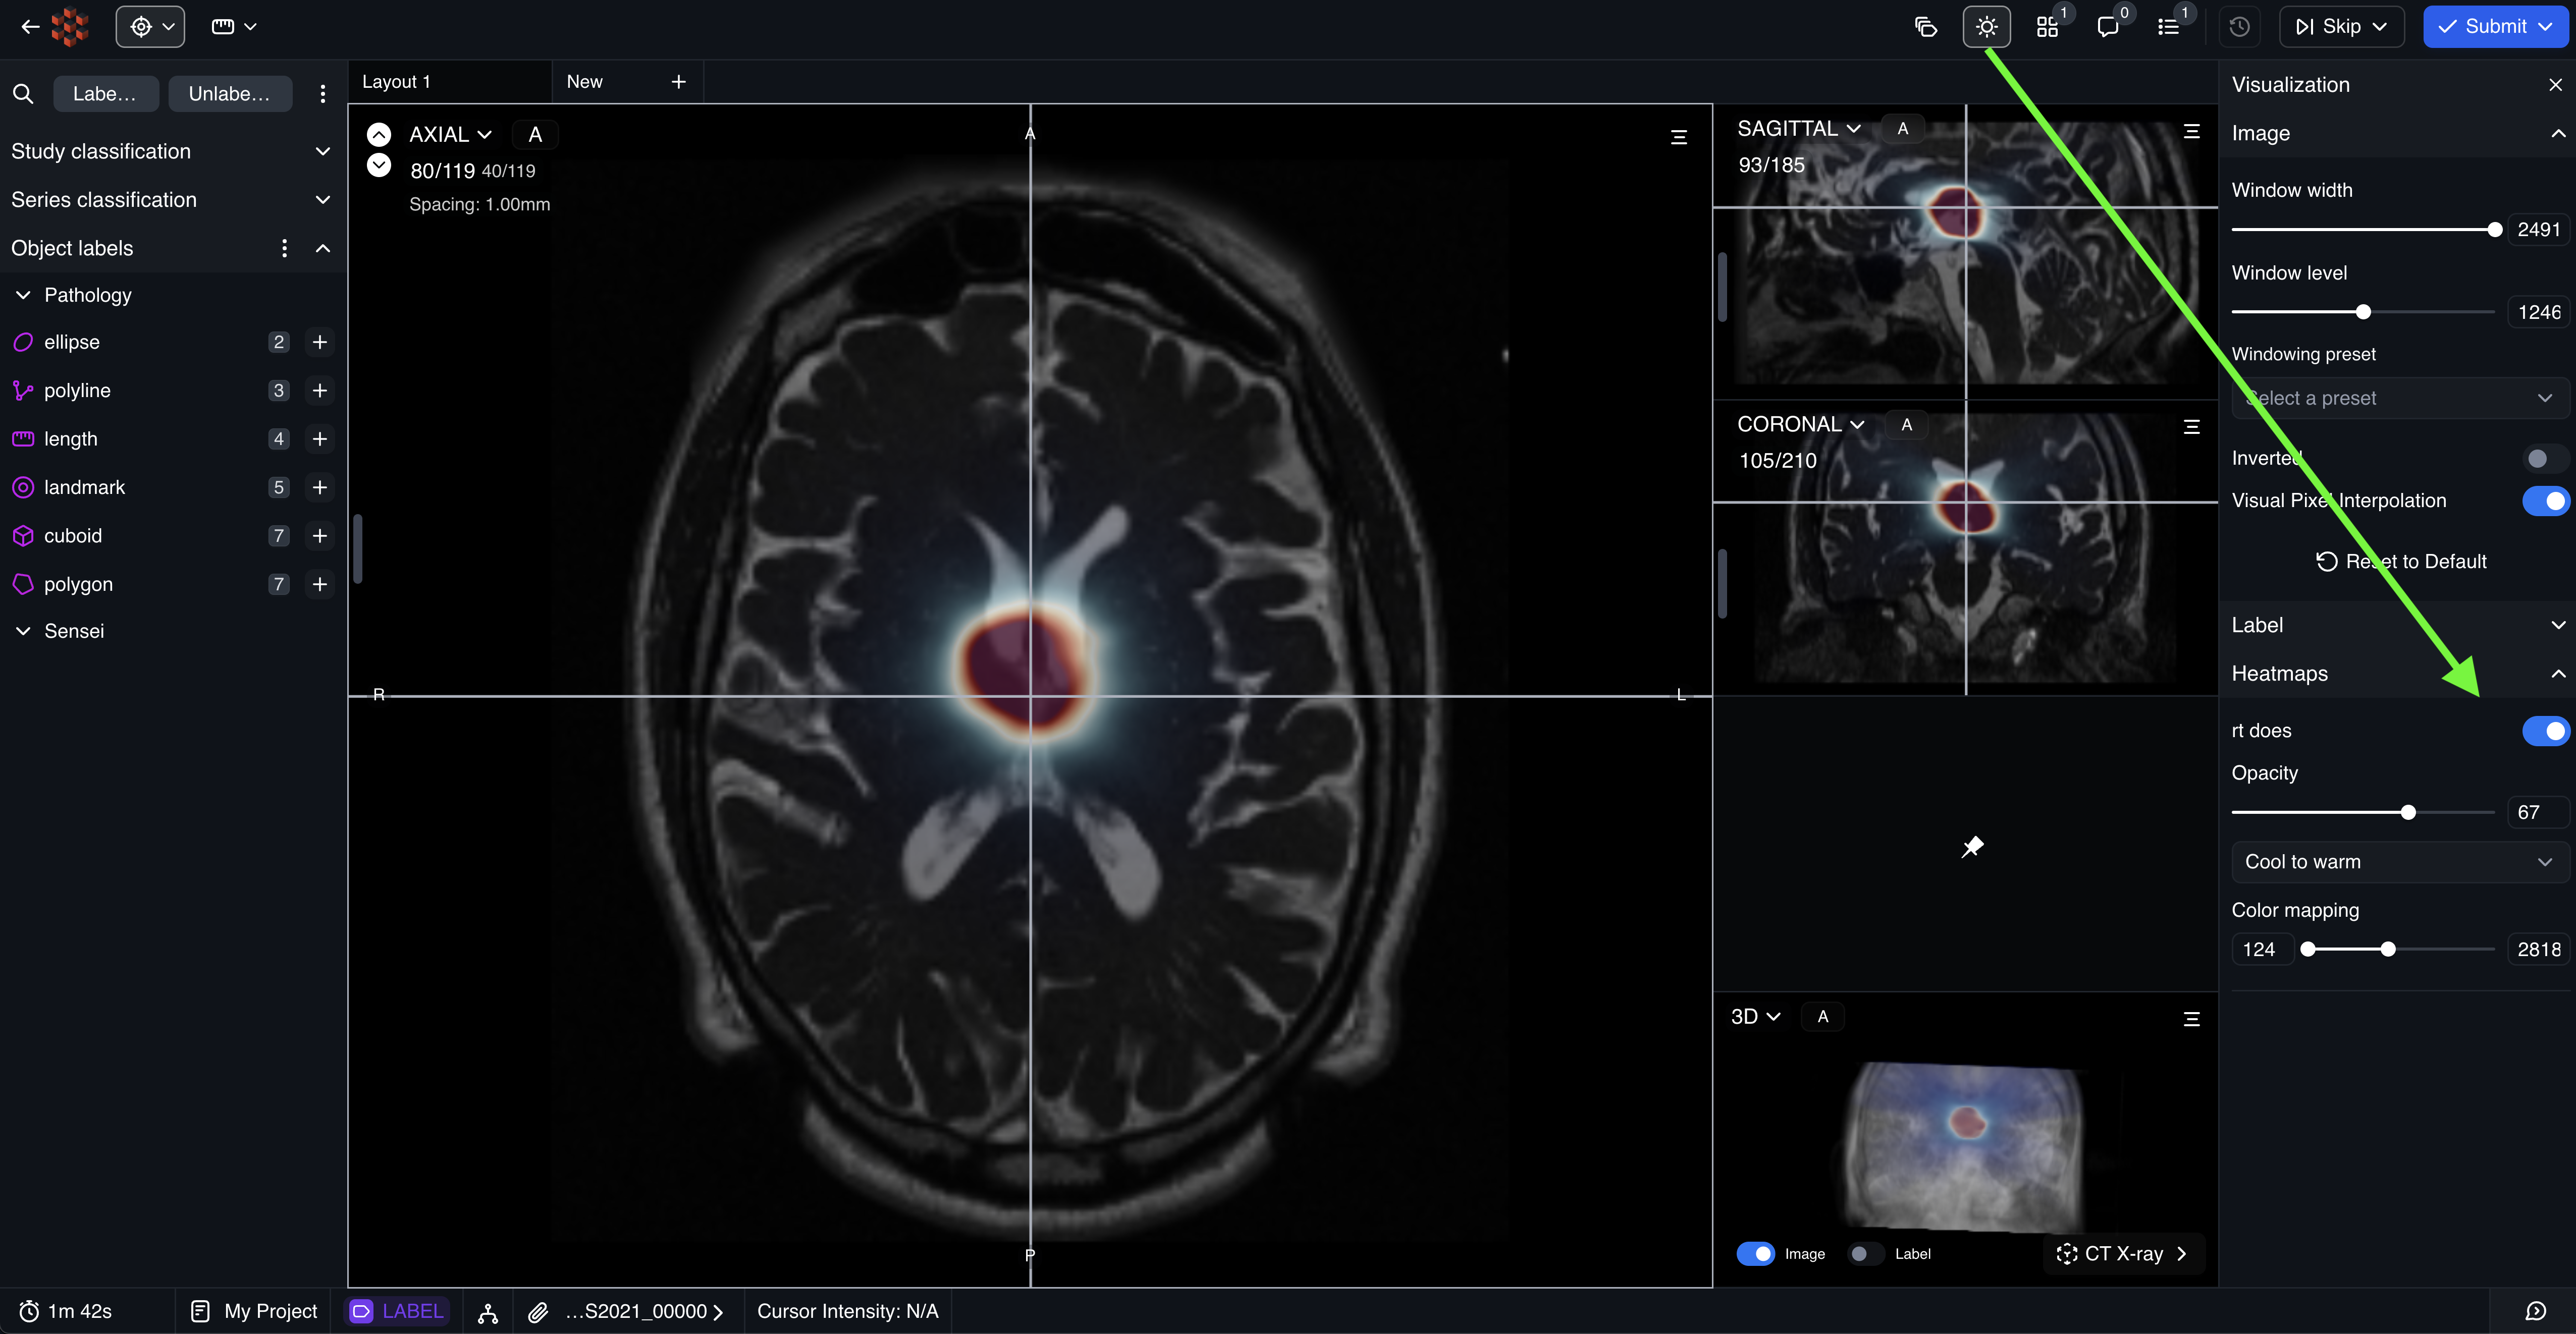
The heat map feature provides a way to overlay scalar volumetric data over the base image for reference purposes. In that sense, you’re not strictly limited to only heat maps - perfusion maps, radiotherapy maps, oxygenization maps, and much more can be visualized alongside your images and annotations.
Heat maps must be uploaded via the SDK.
type Series {
  ...
  heatMaps: [HeatMap]
}

type Series {
  ...
  heatMaps: [HeatMap]
}

type HeatMap {
  name: string;
  item: string; // File path
  // Visualization preset.
  //Available Options: ['Cool to warm' (DEFAULT), 'Warm to cool',
  //                   'Rainbow desaturated', 'Cold and hot', 'X-Ray',
  //                   'Red', 'Blue', 'Green', 'Yellow', 'Magenta']
  preset?: string;
  // Scalar data range. If not provided, it's calculated from the data.
  dataRange?: [number, number];
  // Opacity mapping: [scalar1, opacity1, scalar2, opacity2, ...]
  // E.g., [0, 0, 0.5, 0.5, 1, 1] means scalar 0 has opacity 0, scalar 0.5 has opacity 0.5, scalar 1 has opacity 1.
  opacityPoints?: number[];
  // Color mapping: [scalar1, r1, g1, b1, scalar2, r2, g2, b2, ...]
  // E.g., [0, 0, 0, 1, 0.5, 0, 1, 0, 1, 1, 0, 0] means scalar 0 is blue, scalar 0.5 is green, scalar 1 is red.
  rgbPoints?: number[];
  // Opacity mapping for 3D viewport. If not provided, opacityPoints are used.
  opacityPoints3d?: number[];
}
Upload
Below is a sample script to upload heat maps in a Task.
from typing import List

import redbrick
from redbrick.types.task import InputTask


ORG_ID = "ORG_ID"
PROJECT_ID = "PROJECT_ID"
API_KEY = "API_KEY"
URL = "https://preview.redbrickai.com"

project = redbrick.get_project(ORG_ID, PROJECT_ID, API_KEY, URL)

points: List[InputTask] = [
    {
        "name": "sdk-public",
        "series": [
            {
                "items": [
                    "/path/to/image/inst1.dcm",
                    "/path/to/image/inst2.dcm",
                    "/path/to/image/inst3.dcm",
                ],
                "heatMaps": [
                    {"name": "heatmap 1", "item": "/path/to/heatmap1.nii.gz"},
                    {"name": "heatmap 2", "item": "/path/to/heatmap2.nii.gz"},
                ],
            }
        ],
    }
]

project.upload.create_datapoints(redbrick.StorageMethod.REDBRICK, points)
Visualization
You can configure the gradients, opacity, and other settings by expanding the Heatmaps section in the Visualization Panel in the right sidebar.