As ofDocumentation Index
Fetch the complete documentation index at: https://docs.redbrickai.com/llms.txt
Use this file to discover all available pages before exploring further.
version 1.1.0, the RedBrick UI offers a variety of metrics in order to make tracking your (or your team’s) progress easier than ever before.
Project Analytics
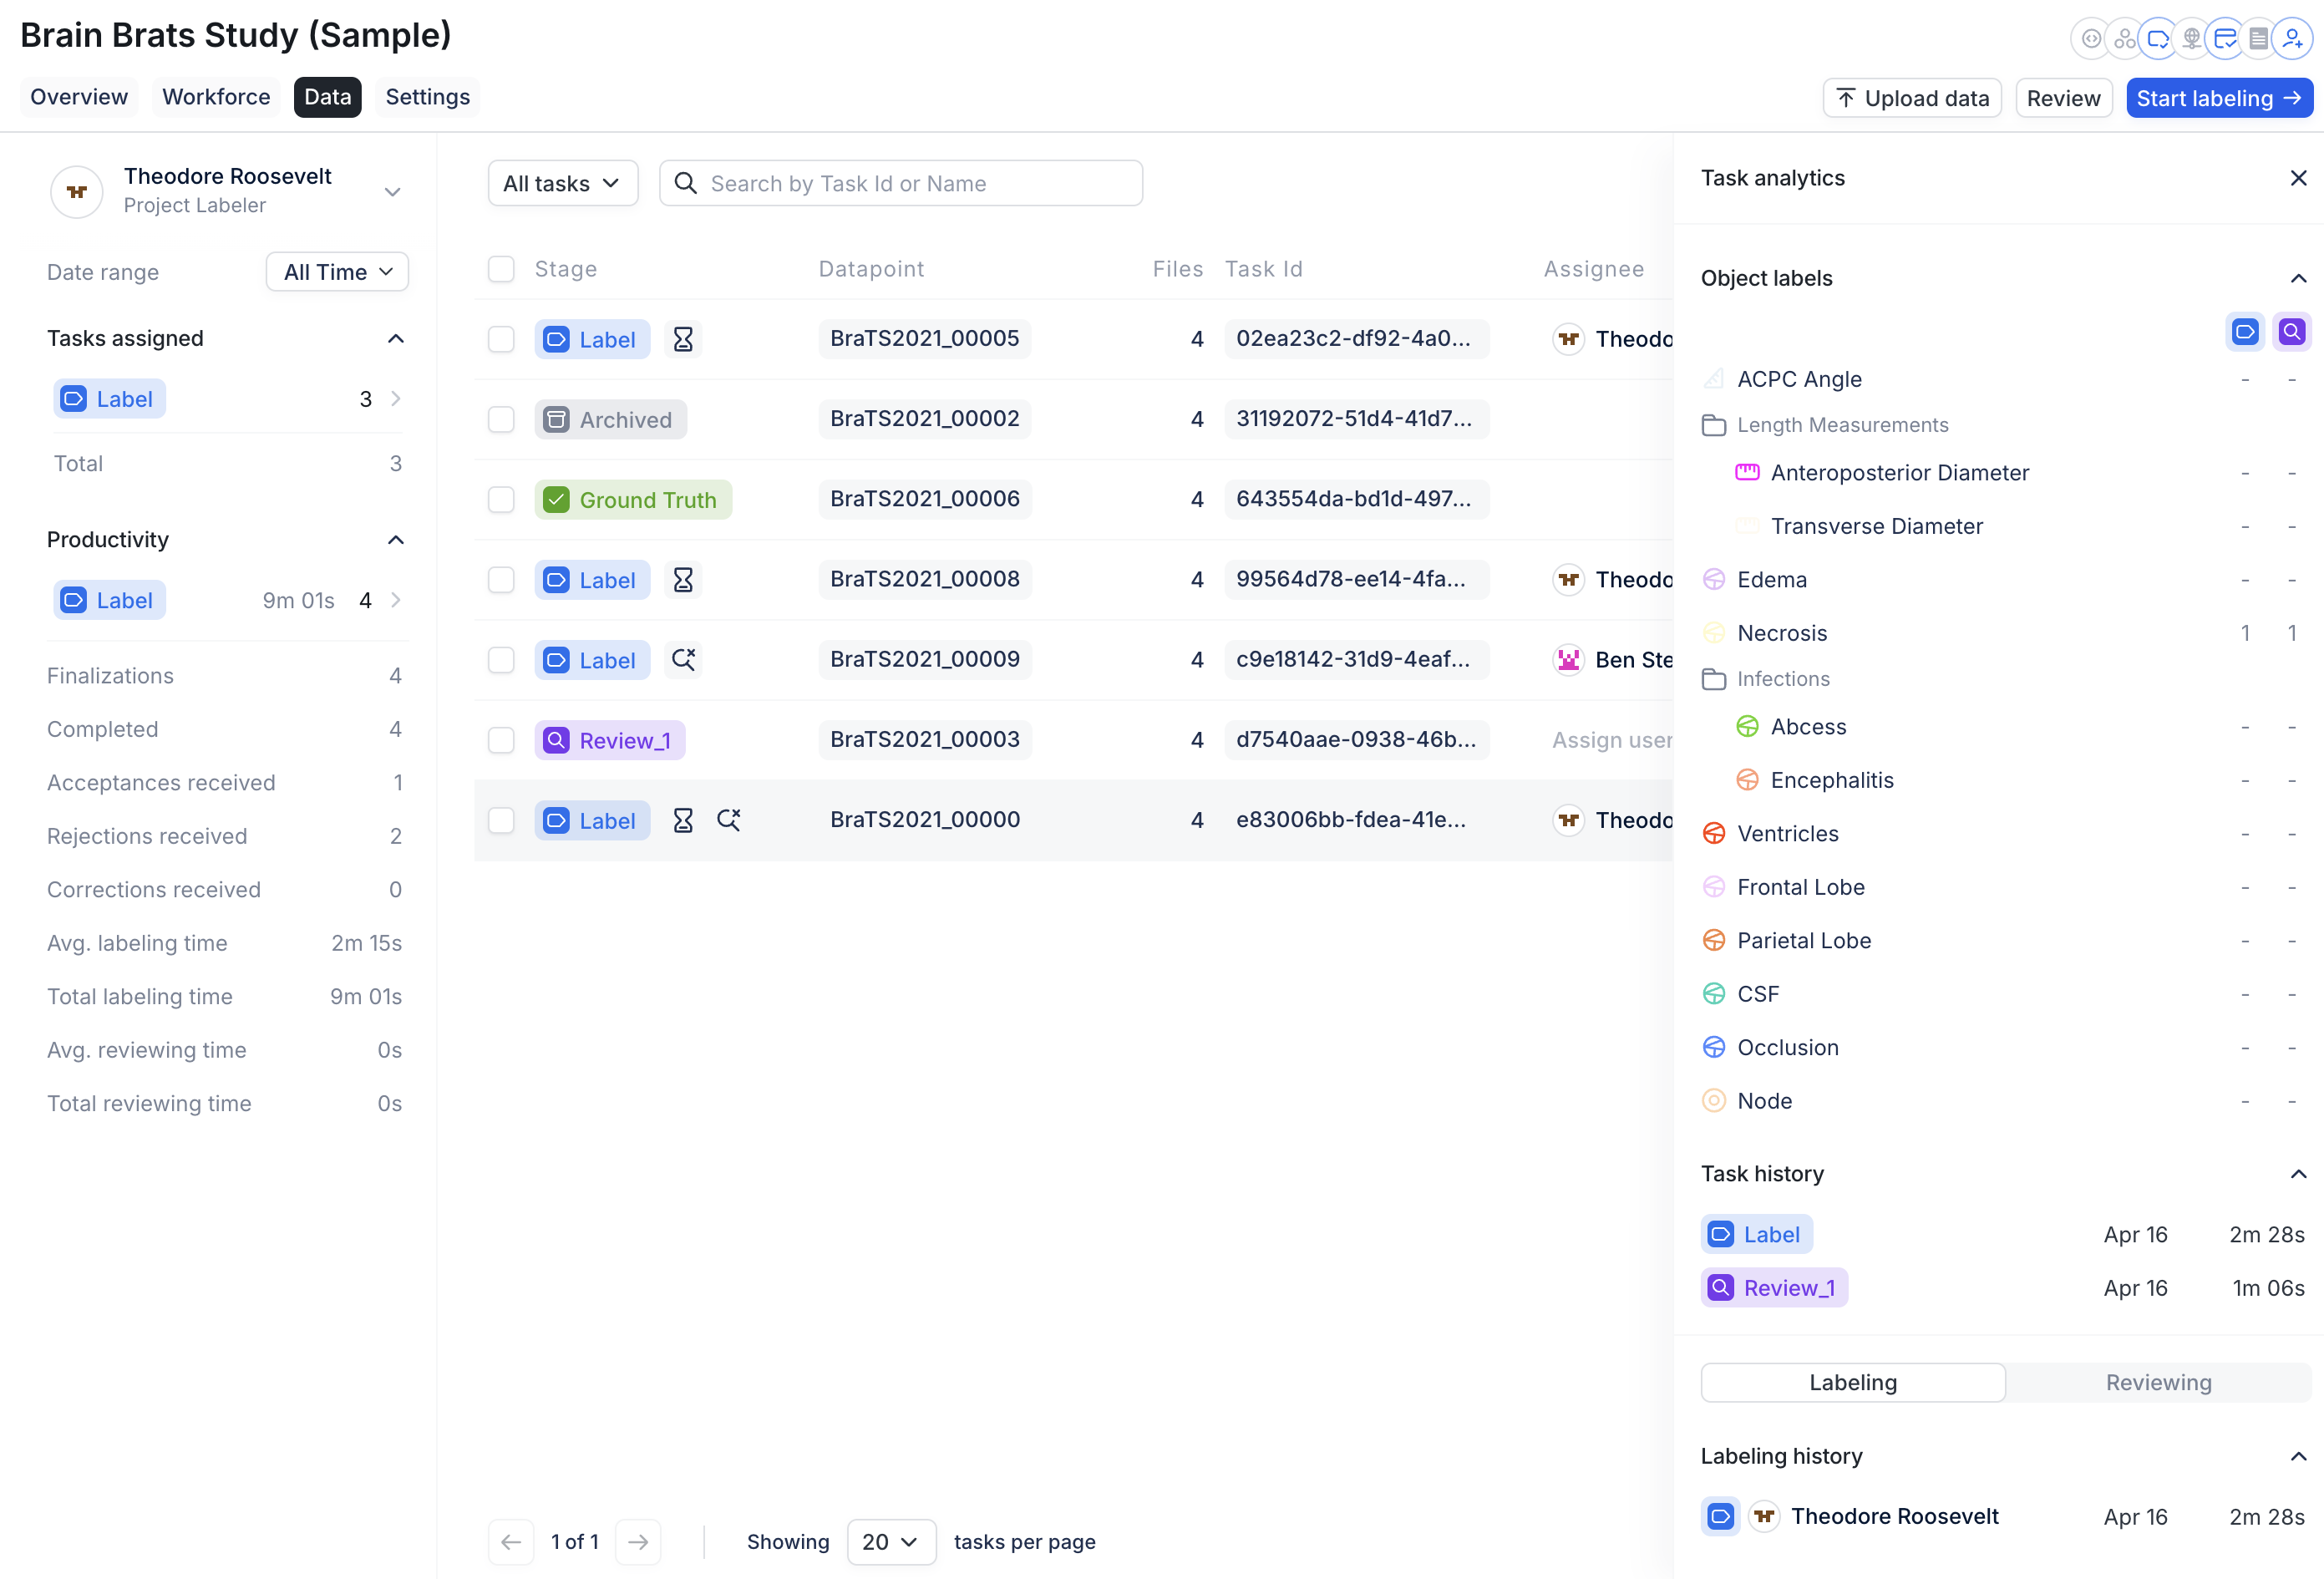
On your Project’s Data Page, you can access a variety of productivity-related information about the Project Workforce by using the lefthand toolbar and applying the desired filters. To generate Task-based metrics for a specific user, first select the user in the top-left dropdown field and apply a date range.
- Finalizations - the number of times the User finalized a Task in the Pre-Label or Label Stage;
- Completed - the number of times a Task the User worked on reached the Ground Truth Stage;
- Acceptances received - the number of times a Task the User worked on was accepted in a Review Stage;
- Rejections received - the number of times a Task the User worked on was rejected in a Review Stage;
- Corrections received - the number of times a Task the User worked on was accepted with corrections;
- Avg. labeling time - the average amount of time the User spends on labeling a Task before pushing it to a later Stage;
- Total labeling time - the total amount of time the User has spent on labeling Tasks;
- Avg. reviewing time - the average amount of time the User spends on reviewing a Task before pushing it to a later Stage;
- Total reviewing time - the total amount of time the User has spent on reviewing Tasks;
Task Analytics
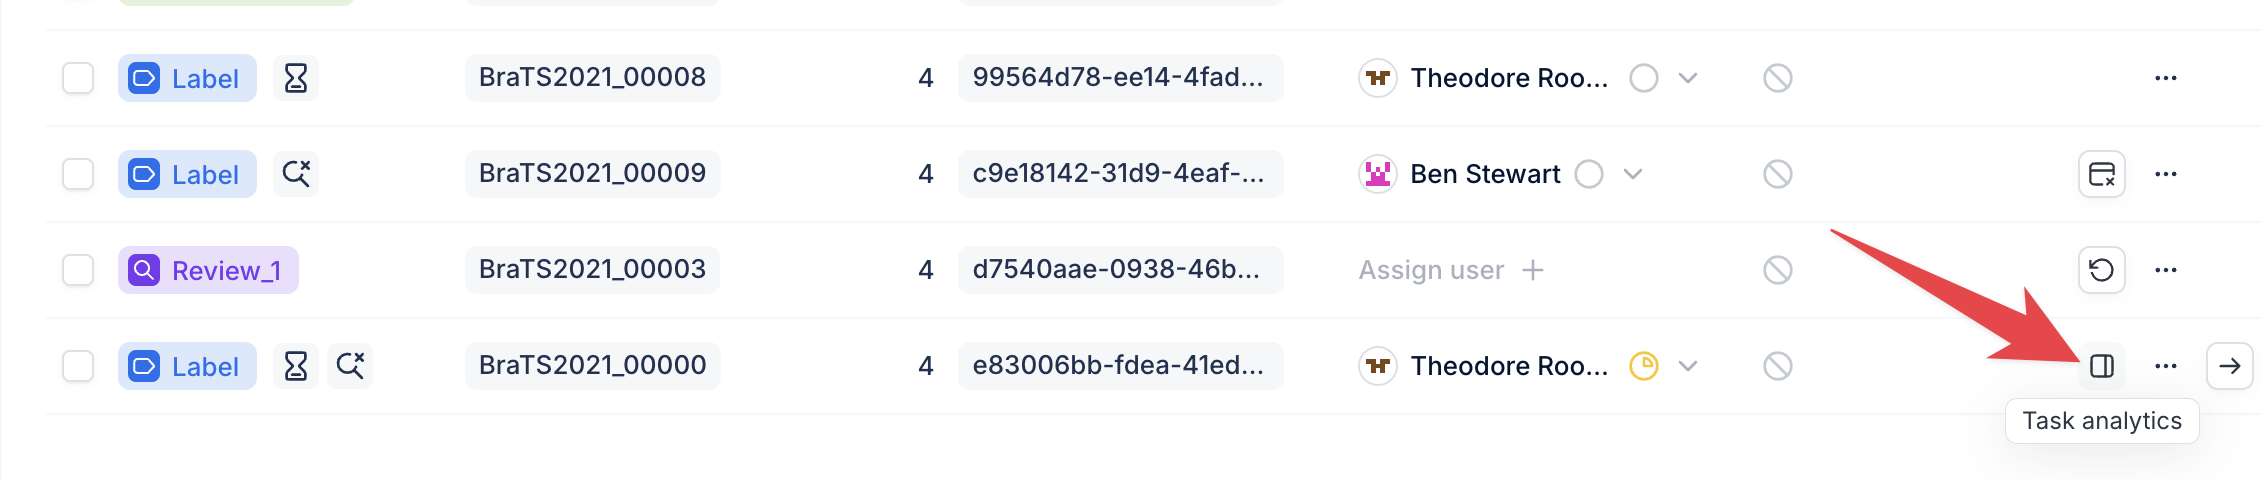
RedBrick also allows you to see information related to the contents of Tasks that you have access to. On the Data Page, you can click on the Task Analytics button for a given Task to see information about:- the Object Labels (i.e. annotations) present in the Task
- Task History
- Labeling History
- Reviewing History